Improving the collaborative tools
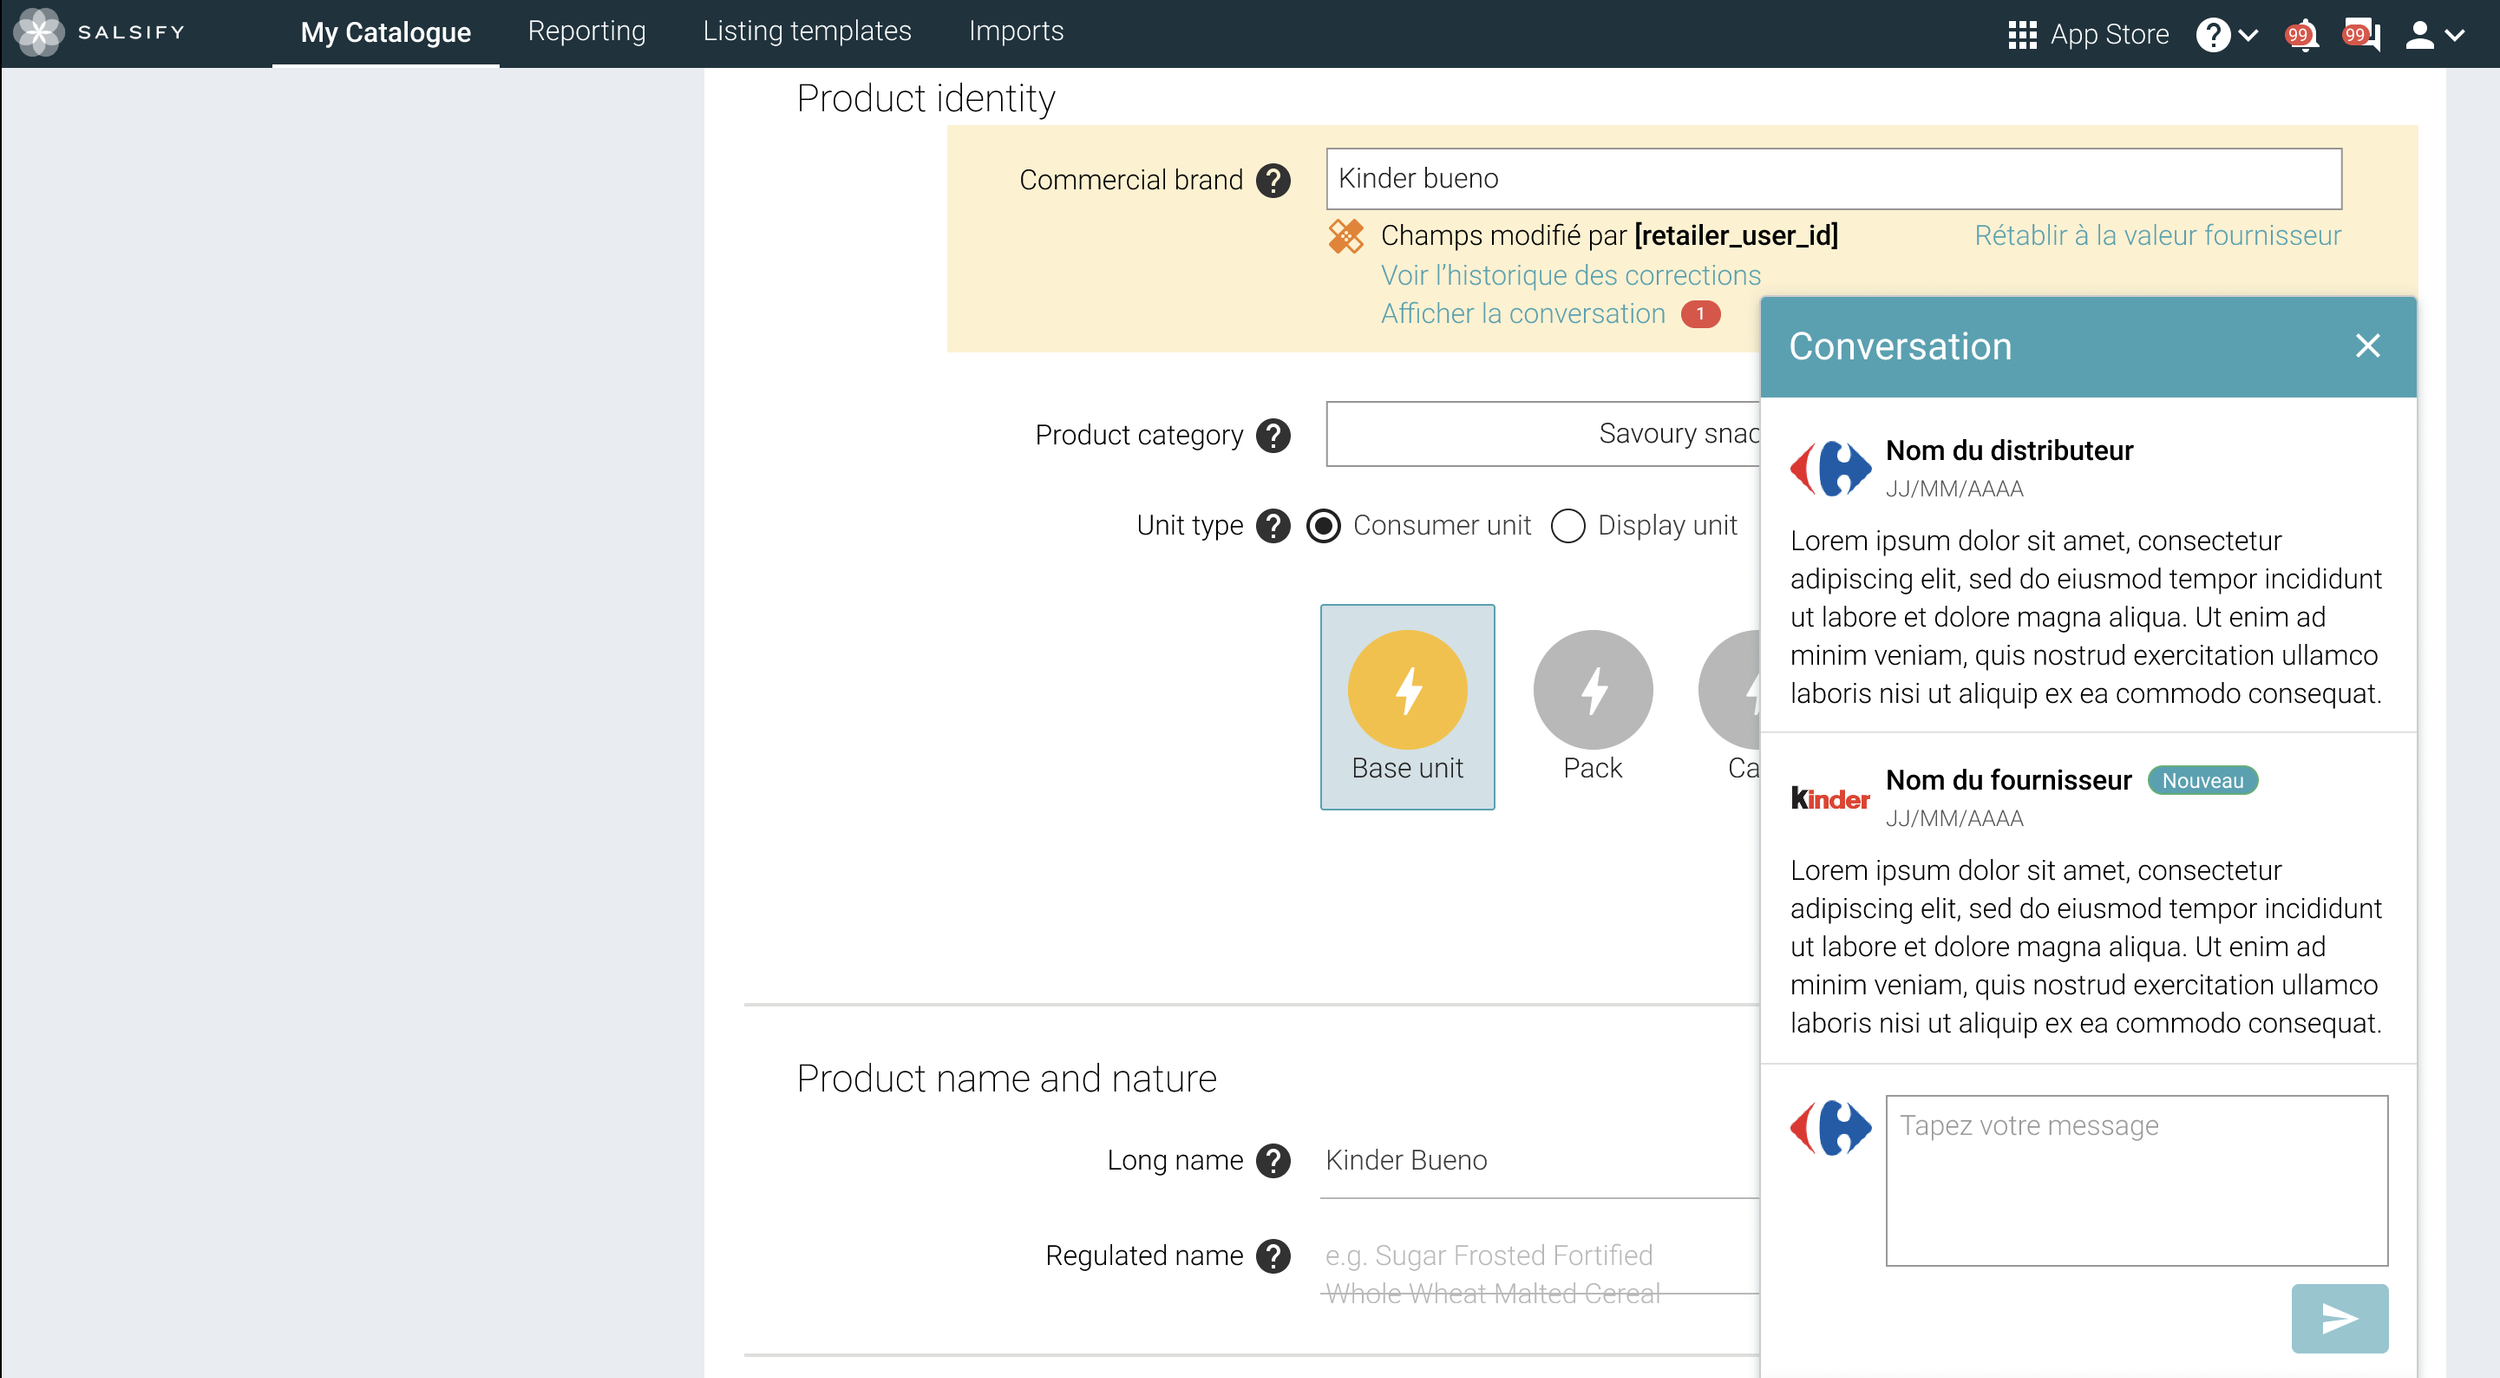
Designing personalized dashboards on each product page to allow retailers to track modification requests and daily tasks.
PRODUCT
Supplier Experience Management System
DURATION
4 months
ROLE
Product designer
DELIVERABLES
User research,
Workshop lead,
Prototyping (both UX/UI),
User testing
-
Salsify is a SaaS B2B solution for global product data sharing. It provides a product experience management system that:
Boosts retailer efficiency and digital shelf success.
Enables suppliers to streamline data for market navigation with automation.
-
The platform enables retailers and suppliers to share and collaborate on product data. Retailers can request or suggest modifications to suppliers.
Previously, retailers faced a challenge in tracking these requests. They had to manually check each field where a modification was requested for every product. They expressed a common need for a more efficient way to track requests and related tasks for each product.
1. Getting started
The initial exploration aimed at understanding the requests we received on the topic as well as exploring the usage of the current feature.
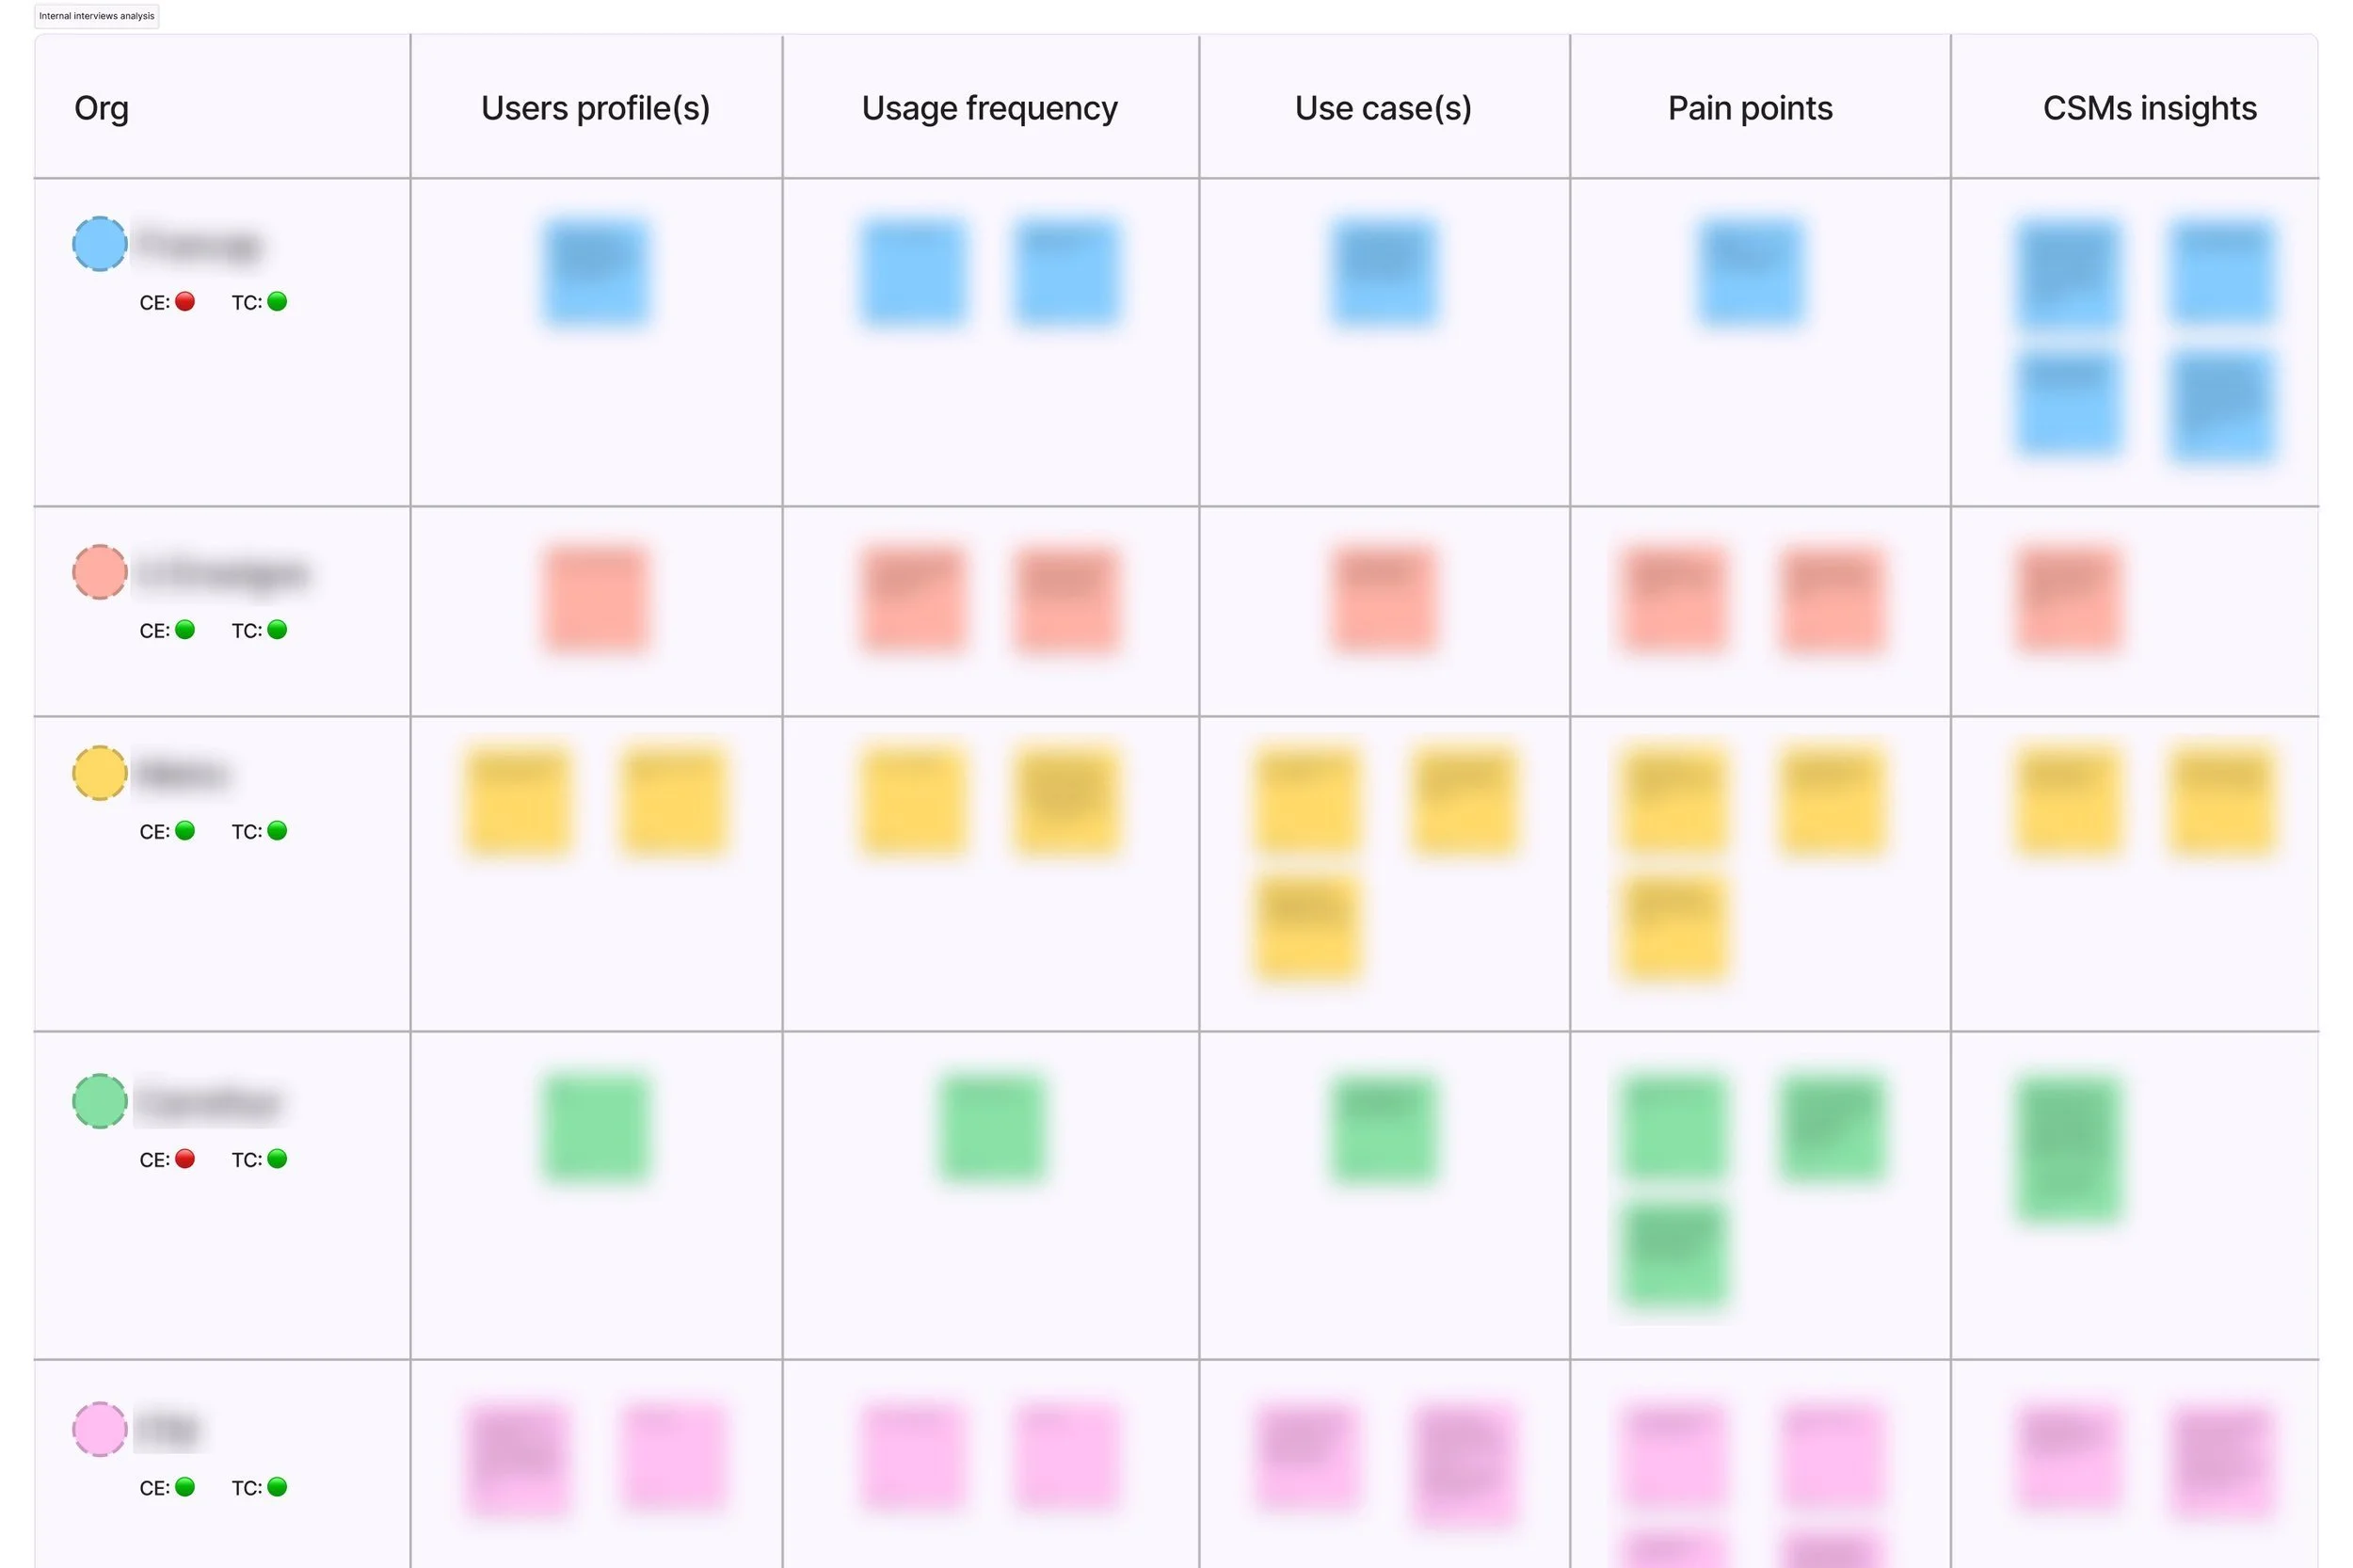
I applied the double diamond strategy throughout this project. In the initial phase, we gathered internal data employing various methods. We collected Voice of Customers (VOCs) feedback through Salesforce, tracked usage data using Mixpanel's event dashboards, and consulted with customer success managers (CSMs) to delve deeper into VOCs.
This preliminary exploration served to clarify the origins of the request, enhance our comprehension of the issue, and identify both knowns and unknowns.
Moreover, we strategically framed the problem to ensure alignment with the company's broader strategy and business requirements.
2. Preparing the research
The research involved both qualitative and quantitative methods. The goal was to get a precise understanding of the usage frequency, the use cases and the pain points.
Our initial exploration, which involved interviews with CSMs and an in-depth analysis of Mixpanel data, yielded crucial insights. This included detailed information on user profiles (such as job roles and primary tasks), usage frequency, potential use cases, pain points, and additional valuable insights.
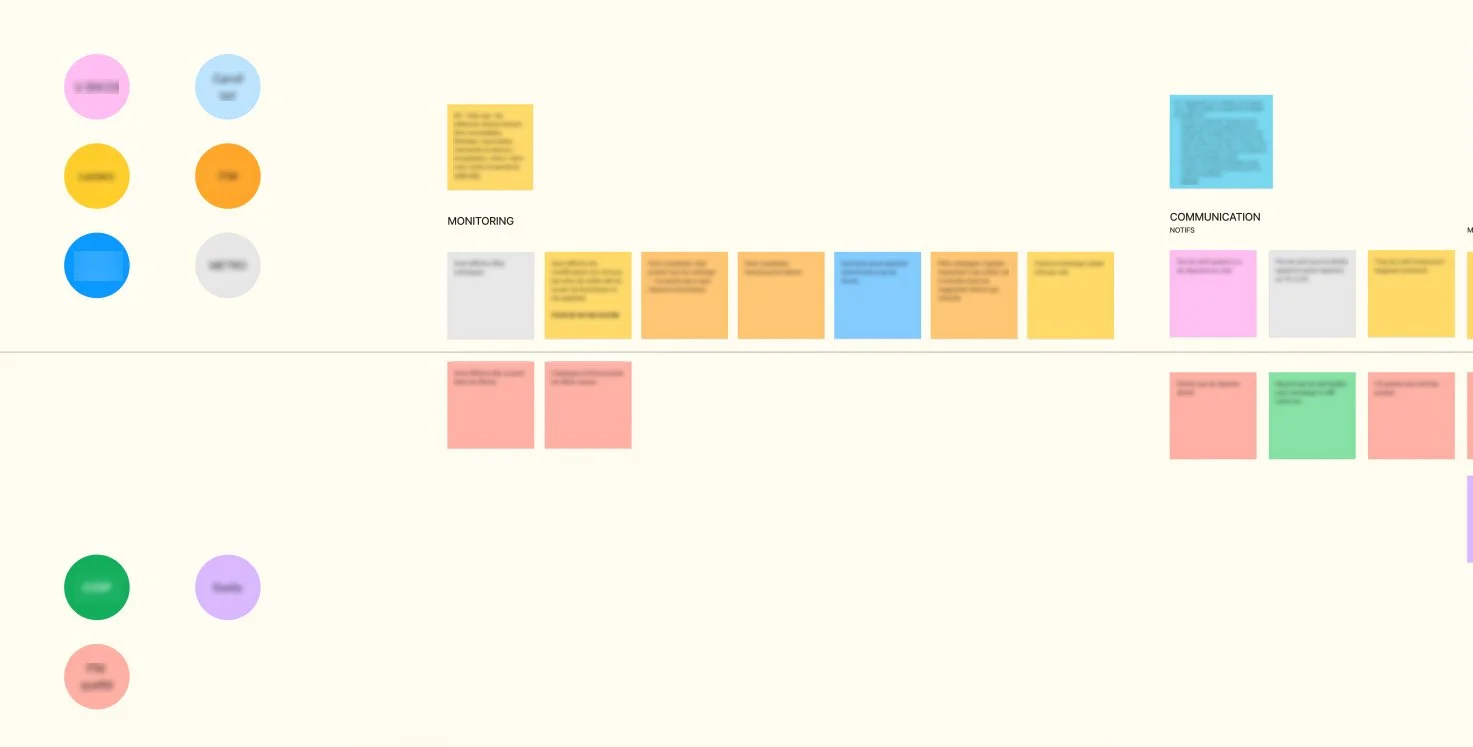
By combining this data with existing information, we conducted an initial mapping through a user journey. This mapping was based on both factual data and our own hypotheses and assumptions.
The internal data collection allowed us to identify both knowns and unknowns, enabling us to establish several research objectives before the interviews. These objectives encompassed:
Getting the overall context.
Understanding the validation processes.
Answering who, when, why and how they use our collaborative features.
Understanding the limitations/painpoints.
Deepening our understanding of the VOCs.
By setting these objectives, we aimed to ensure a thorough exploration of the landscape and gain a holistic understanding of user needs and pain points.
3. Interviews
The user interviews offered valuable insights into our users' backgrounds and how the collaborative features supported their tasks. We also delved into the challenges they encountered.
We conducted interviews with ten users, primarily from the retail sector. Following the interviews, we organized the data into distinct categories. This systematic approach proved instrumental in identifying patterns and common themes among users. By categorizing the interview data, we gained valuable insights that formed the basis for recognizing shared experiences and user perspectives.
4. Exploring the findings and defining the problem
I led a collaborative workshop with the team to create clear visuals illustrating how people use our features.
To ensure a clear and comprehensive story, we adopted a two-step approach.
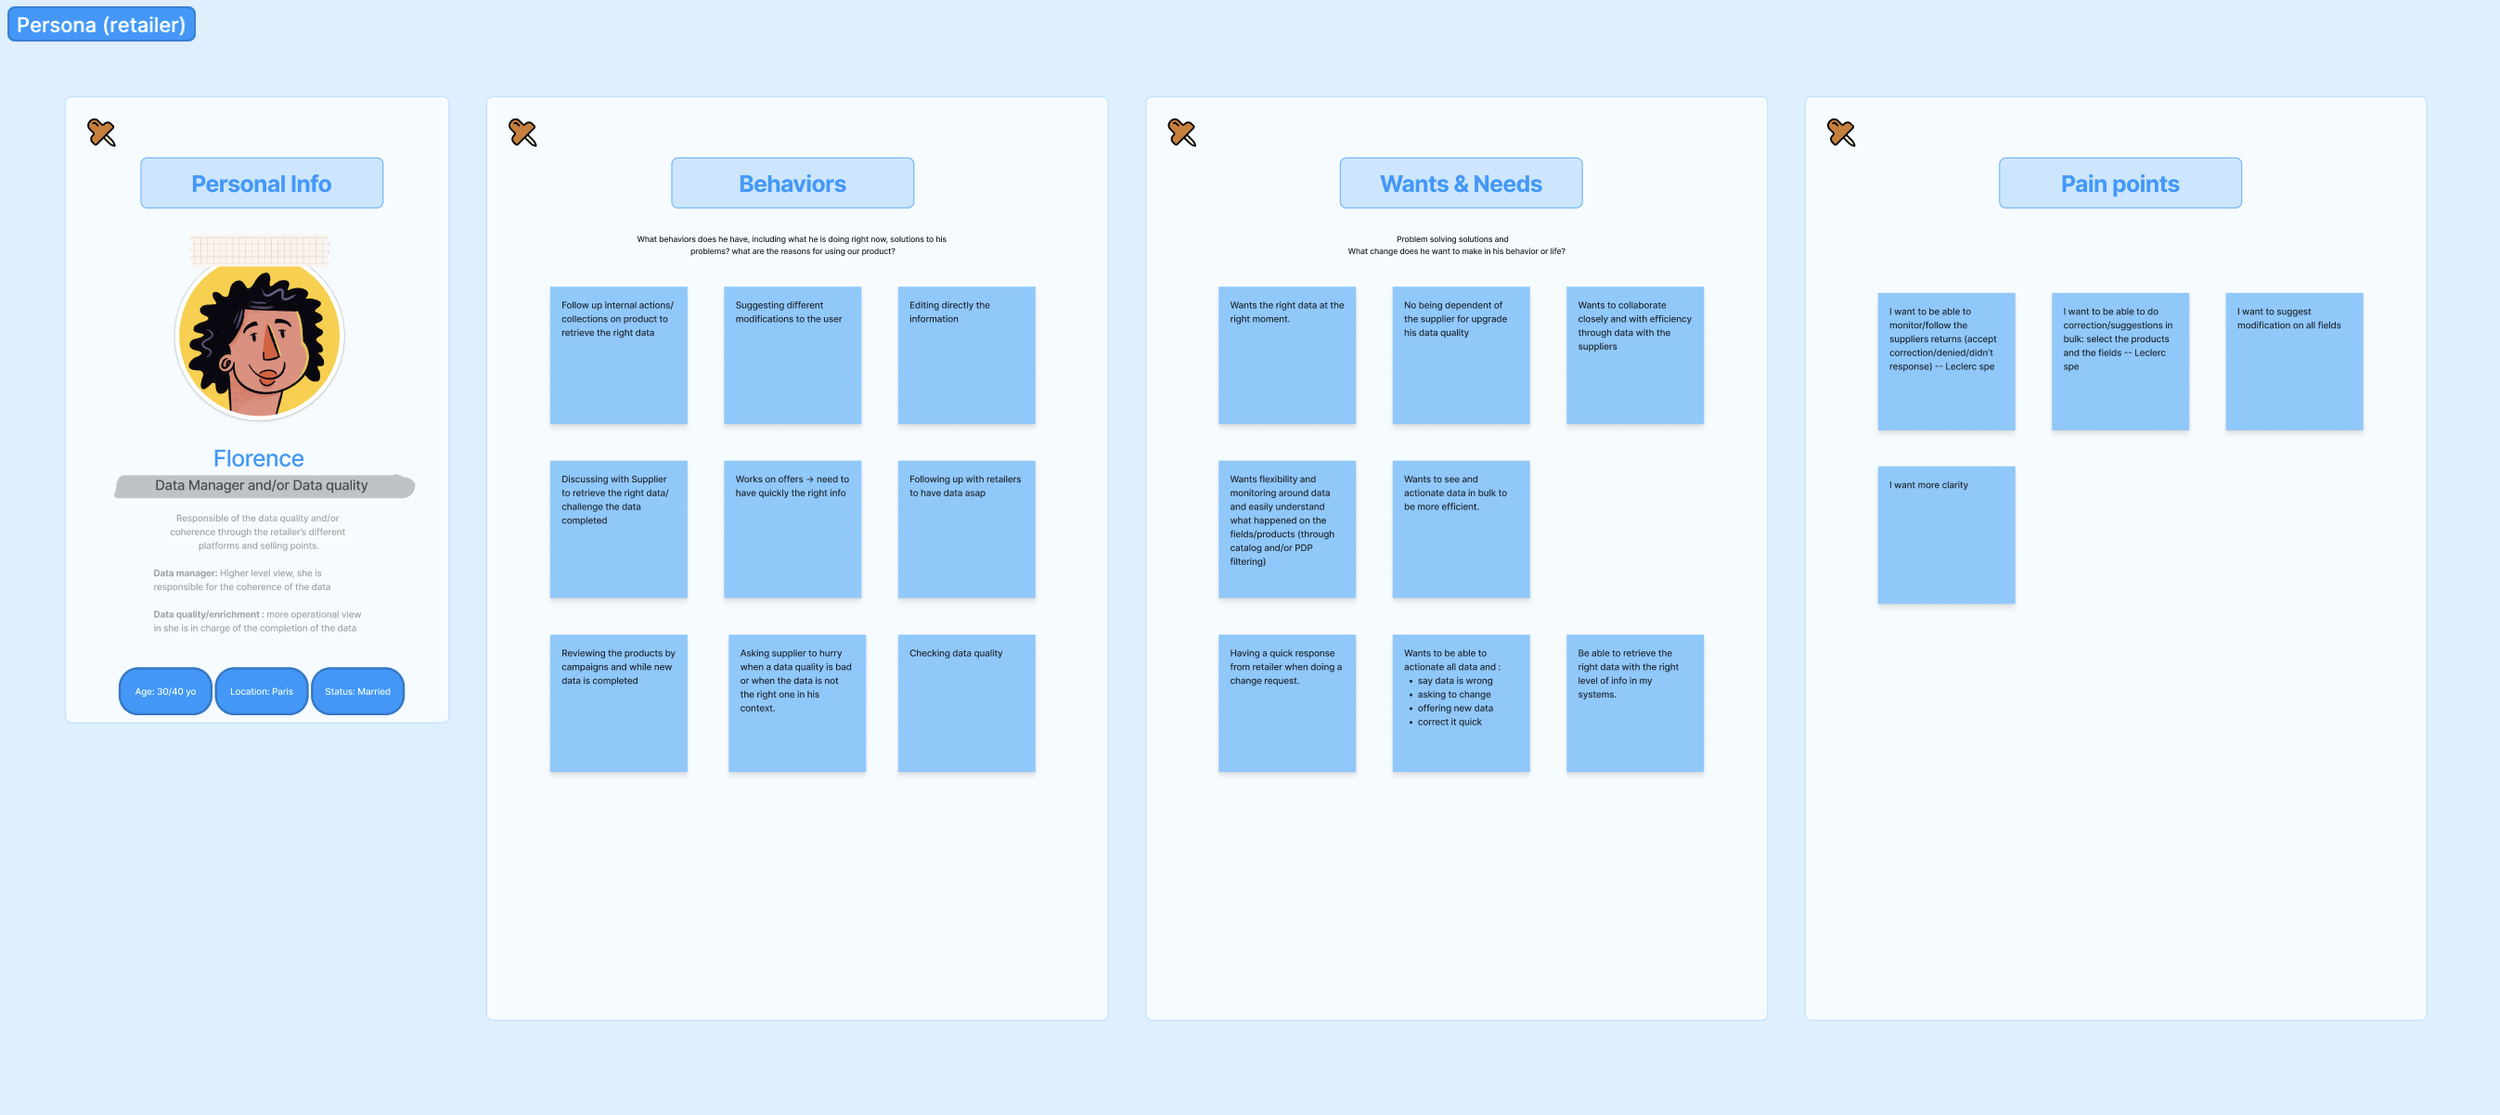
Firstly, we crafted personas, concentrating on significant details such as job roles and daily tasks. This involved highlighting behaviors, wants and needs, and noteworthy pain points that emerged from our research.
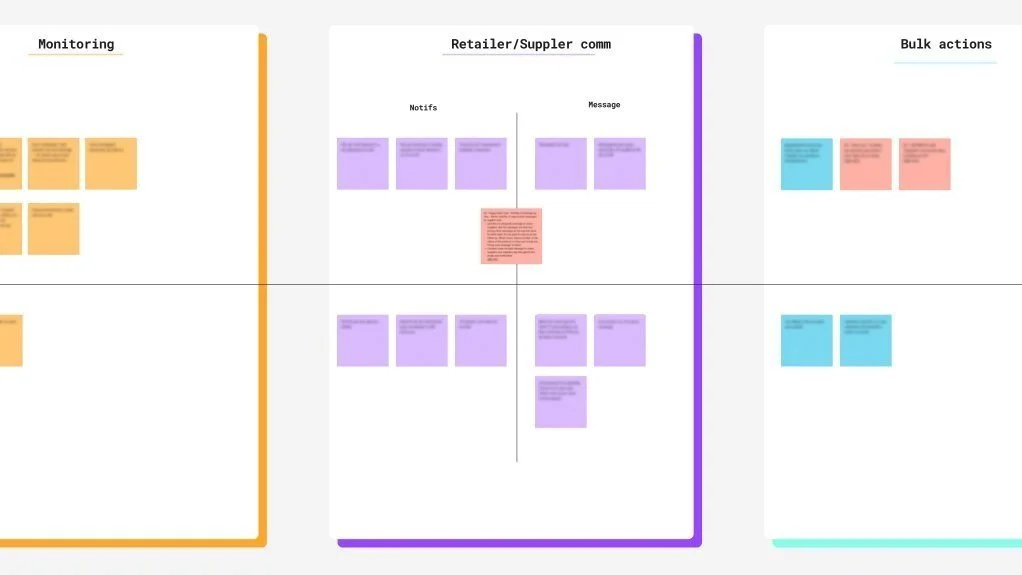
Subsequently, we refined our initial user journey by eximining and completing each step. These detailed user journeys delineated critical phases and tasks that users undertake daily to achieve their goals. They also underscored key touchpoints within the platform.
These visuals played a crucial role in linking pain points with specific steps, providing a foundation to brainstorm new ideas and opportunities. The personas and refined user journeys collectively formed a comprehensive framework for understanding user experiences and guiding future design decisions.
✍️ Results
These various workshops helped us:
Discover the steps we were missing in our journey.
Link our pain points to the right parts of the platform.
Decide which opportunities had more value for our users.
5. Prioritising the opportunities
Once we had a clear understanding of our primary pain points, the next step was to prioritise our opportunities.
We shared our findings with the entire team and, in collaboration with stakeholders, used a prioritisation matrix to identify opportunities that would provide the most value to both users and the business. We also used t-shirt sizing to gauge the technical impact of each opportunity.
✍️ Results
After prioritization, here are the opportunities we chose to focus on first:
Implementing a monitoring system for retailers to track their requests.
Enabling users to perform specific actions in bulk.
Introducing a history of field modifications.
Shifting requests from the general chat to in-line comments to enhance clarity.
6. Prototyping
After the user workflow was established and the primary ideas were sketched in collaboration with stakeholders, I moved on to the prototyping phase.
Following the ideation phase, I had a clear vision of the user experience and the ideas we wanted to prioritise. Using Figma, I began by prototyping wireframes, which were later followed by higher fidelity mock-ups.
8. User testing and handoff to developers
Once the prototypes were completed, and the team was aligned, I conducted user tests with suppliers.
To ensure a comprehensive understanding of the user test results, I used an Excel file configured to provide us with:
The success rate for each step of the prototype test (both individual and global).
The overall success rate of the test for each participant.
The overall success rate of the test in general.
Testing the prototype allowed me to identify areas for improvement. After collecting feedback, I iterated on the prototype and promptly cross-checked with some of our users, especially those who had highlighted areas for improvement during the tests.
Next step involved writing the specs on both Figma and JIRA to prepare the handoff to the developers.
10. Expected results
As a reminder, our goal was to improve the collaborative tools in order to fasten data completion.
Following deployment and as we await more concrete metrics, our expected goals are:
Improving the response rate of retailers to streamline the data completion process.
Significantly reducing support tickets related to data compliance.
🛑 ✋ That’s the end of the road!
To the next project?


